Henry Gantt, an American engineer and project management consultant refined the project management and scheduling chart in the early 1900s.
Since 1917, the project planning and scheduling chart is known as the Gantt chart.
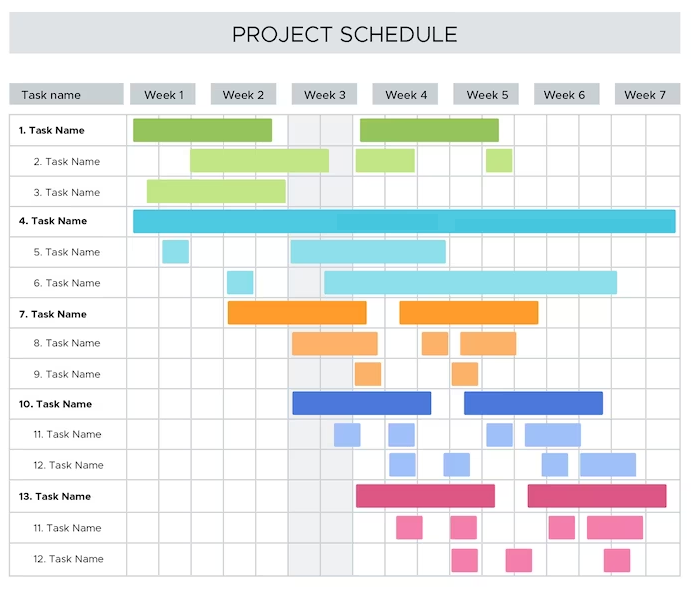
Gantt chart is a project management tool that is used to increase the efficiency of project planning and execution.
It helps to plan a project, allocate resources, control costs, and track progress.
The chart allows one to see the various activities in a project, the start and end date of each activity and the project, the durations of each activity, and the person responsible. It also shows the activities that overlap each other.
It is the most commonly used tool in project management.
The Gantt chart is divided into two parts, on the left-hand side is a list of activities and their details. On the left side is the timeline for the completion of each activity.
The project scheduling activity starts with a project plan. The Project plan mentions the schedule plan, schedule baseline, deliverables, project timelines, and resource requirements. This project schedule gives clarity to all the stakeholders in the project and provides complete transparency.
The chart displays details like –
Task Name – The name of the activity undertaken.
Task Priority – The urgency of each task. This helps to allocate resources effectively
Due Dates – The planned start and planned finish dates
Task Dependencies – It shows if any task is dependent on other tasks
Per cent Completion – It shows how much of the task is completed and the remainder
Critical Path – It is the longest path from the start to the end of the project
The base objective of this chart is to show the scope of the project, the deliverables, the stakeholders, and mainly the progress.
What are the steps to create a Gantt chart?
Step 1 – Create a Scope Baseline
It consists of three important components: 1) the Scope Statement, 2) the Work Breakdown Structure (WBS), and 3) the WBS Dictionary. The baseline should cover the entire project scope.
Step 2 – Creating Activities
The WBS structure needs to be further divided into individual activities or tasks to create a schedule. The schedule should be effective and efficient and should include deadlines and milestones.
Step 3 – Activity Sequencing
This step includes giving the activities a proper flow by sequencing them correctly. This is important since some activities may be interlinked and interdependent.
Step 4 – Deciding the Duration
Once the activities in the work package are identified and arranged sequentially, the time estimate required to complete each activity has to be decided. The start and end dates need to be defined. Adequate time needs to be given to each task. The time estimates should also consider any potential bottlenecks or risks.
Step 5 – Resource Planning
Resources include labour, material, and equipment. The appropriate resources for each activity must be identified. A resource calendar can be created to show when resources are needed and available. This helps to allocate resources according to project requirements.
Step 6 – Creating a Schedule
The most important step, creating the Gantt chart. Once the resources, time estimates and activities are identified, the information is fed into the chart. Review the chart from time to time to ensure all the tasks are covered and risks are taken into account. Using the appropriate formulas, the progress of each task can be mapped in the form of a stacked bar graph.
What are the pros and cons of a Gantt chart?
Pros –
- The clarity in planning the tasks – The entire project is broken down into different activities which can be individually tracked and monitored. This helps to complete the project systematically and efficiently.
- Transparency to stakeholders – Transparency can be maintained as the progress tracking and the task details are all mentioned in one place. The stakeholders can view the progress at any time. This gives them a clear idea of the estimated timelines and the actual work progression.
- Clarity of tasks – The process owner is also mentioned in the chart. This gives a fair idea of the person responsible for each activity. In the case of interdependent activities, the process owners can easily coordinate and accomplish the tasks within the timeline.
- Time management – Since the start and end date of each task are predetermined and all the process owners have the access to view it, time management can be done more efficiently. It also brings everyone abreast with the progress and keeps a lookout for any discrepancies.
- Software – Many software are available, that make project planning and scheduling easy. The process becomes automated and the reports are system generated which gives greater accuracy.
Cons –
- Work Breakdown – The WBS has to be well thought out and the task identification needs to be appropriate. In case any task is missed, the scheduling fails.
- Complex chart – If the scope of the project is large and the activities become very granular, it becomes difficult to read the chart, manage and monitor it.
- Skills – It requires the project manager to have the necessary skills of analysing, forecasting, measuring, and controlling to create and manage a Gantt chart. If the project manager lacks these qualities, then the project risks failure.
Updating skills to suit the changing demands of the tech-driven corporate world is crucial.
MITSDE helps you in this regard. The AICTE-approved distance learning institute imparts relevant project management skills that help professionals excel in their careers.
MITSDE Advantage –
MIT School of Distance Education (MITSDE) is an institute that understands the current skills gap in the market and strives hard to reduce it. Hence, MITSDE brings you an oonline project management coursenline course – PG Diploma (PGDM Project Management) in Project Management.
The online project management course covers the concept, philosophy, and importance of Project Management, hands-on tools like Microsoft Project and Jira, project analysis, risk management, and project audit techniques.